
Location
'Location' is taken from a Tapawera District Council document and is a way of defining areas within our community. Some responders had 'Tadmor Valley Road', I treated these as 'Tadmor'; they may live closer to 'Rakau', but I don't know. Possibly this is reflected in the relatively large number of responses from 'Tadmor'.
Question 14 - Explanation
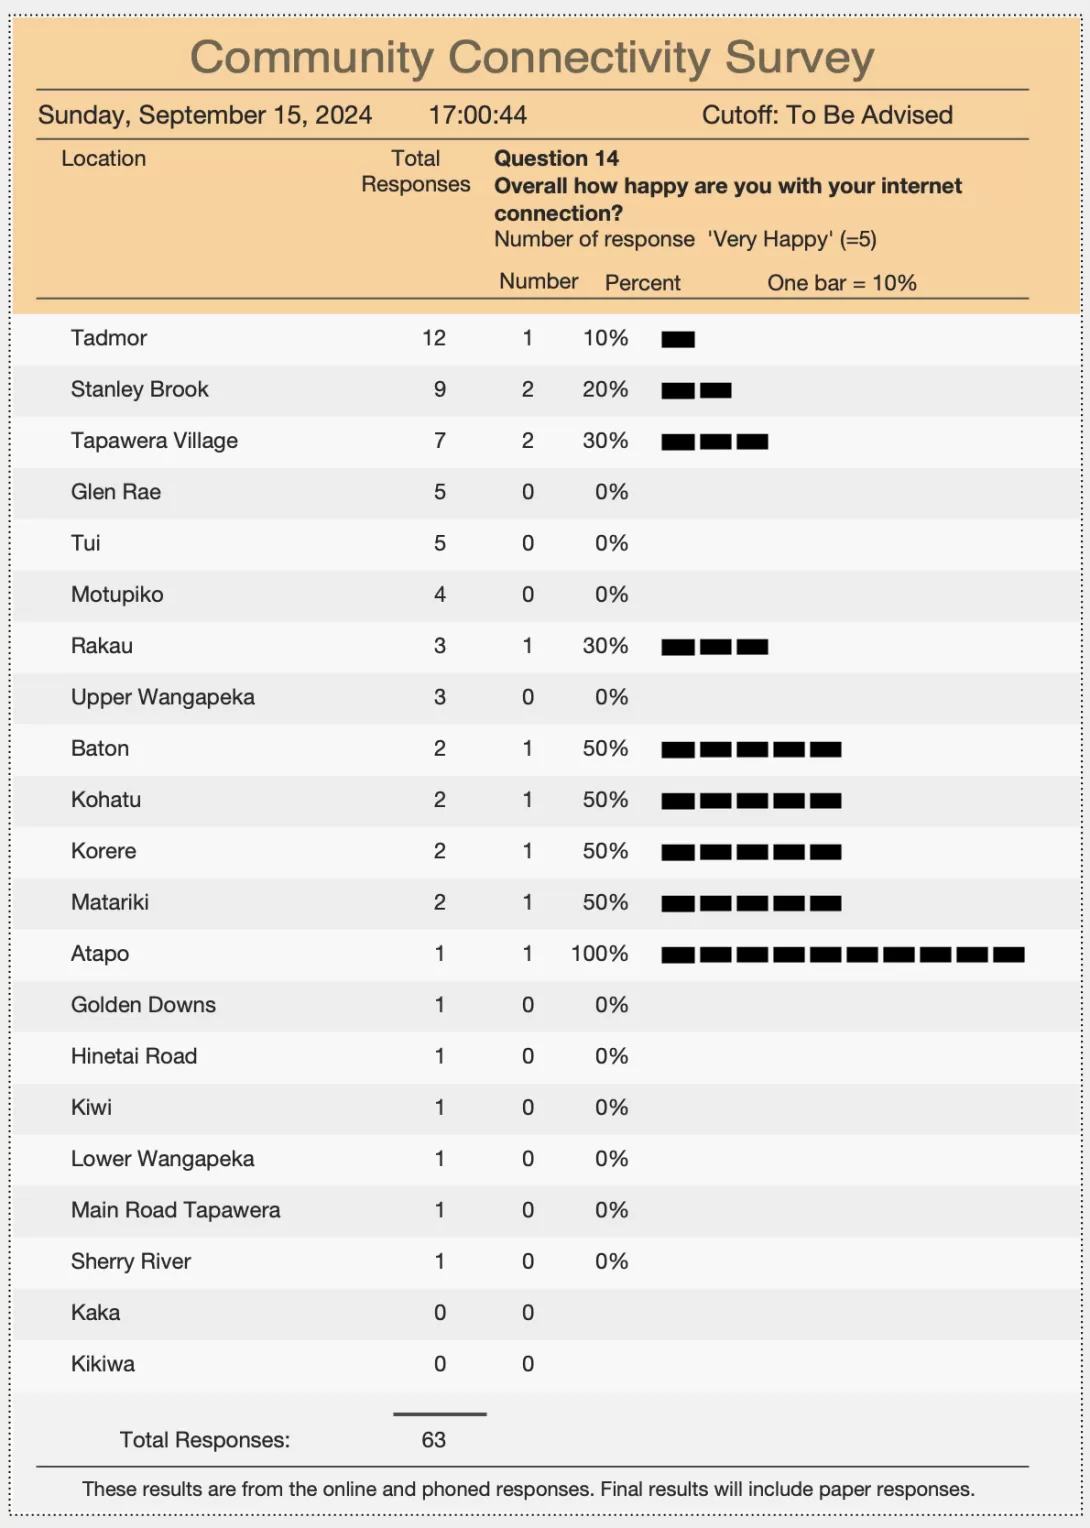
- Question 14, for internet, asks "Overall how happy are you with your connection?". It is the first graphed result (see the bar graph above) and is the focus of my analysis so far.
- Other graphs like this will be produced once the survey is completed. All pie chart reports with the current data, produced by Google Form are here.
- When I worked at Telecom (many moons ago) they were interested in counting only the survey responses where customers responded with "Excellent", and any response less than "Excellent" meant that the service is improvable. So with this survey, and for this graph, I am interested only in "Very Happy", and anything less means it's improvable.
- Looking at "Tadmor" there are (to date) 12 responses in total. Of these 12 there was only 1 that rated Question 14 with a score of "Very Happy" (scored 5). So this represents 10% of the total of 12 responses. This is also represented by one bar "-".
- "Stanley Brook" has a total of 9 responses with 2 rating "Overall how happy are you with your connection?" as "Very Happy".
Observations
Copy of paper Survey Questionnaire here. The following comments apply to the survey results shown on the above graph.
Observations on responses so far:
- The graphed results shown above are responses to Question 14, "Overall how happy are you with you internet connection?". Results indicate that households in the top three areas are not Very Happy. In Tadmor only 10% are Very Happy, leaving 90% less than Very Happy, answering Question 14 with a score between 1 - 4.
- We have 63 responses spread over 21 locations. Some locations show zero or low numbers of responses.
- Where the location covers a large area (e.g. Sherry Valley) there are insufficient responses to draw a conclusion.
- Where the area is confined (eg. Upper Wangapeka) the three responses are probably a realistic or indicative result as there are not many households in this location.
- Indications are that a higher number of surveys returned would show a higher percentage of households dissatisfied with with the internet connection in the following areas; Tadmor, Stanley Brook and Tapawera Village. Tadmor with the most responses to the survey (twelve), are the unhappiest, along with Glen Rae, Tui and Motupiko.
- Upper Wangapeka is sparsely populated, and all three responses show that no household is Very Happy.
Summary
- The above results are for Question 14 only, results for other questions will be graphed later.
- The survey is giving some great results. Also see all results so far.
- Some of the locations have a small number of households, for example, Upper Wangapeka and Kaka. In contrast we have areas such as Sherry River and Main Road Tapawera with many households.
- Apart from the graphs produced by Google Forms, a spreadsheet containing all responses can be downloaded. This is how the above graph was created. We can compare responses against the type of connectivity.